With this post I aim to present a lightweight CPU Monitoring solution for individual processes that can be automated on Windows Hosts. This can be useful if we see a constant CPU peak on some of our MSSQL Hosts but no heavy load on the instance itself. In such cases we need to monitor all the other processes individually which might be running on the host.
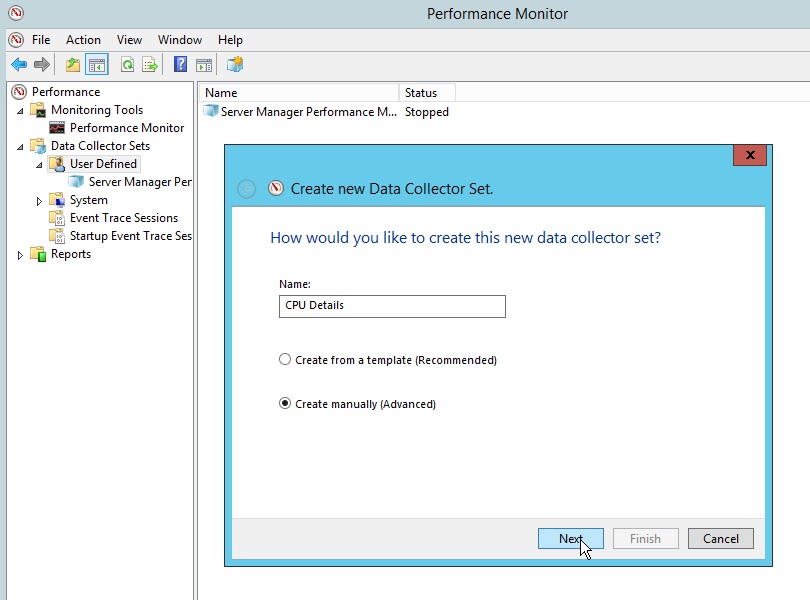
First we will create the PerfMon counter with the help of the GUI. After starting Perfmon we need to create a new User Defined Collector set:
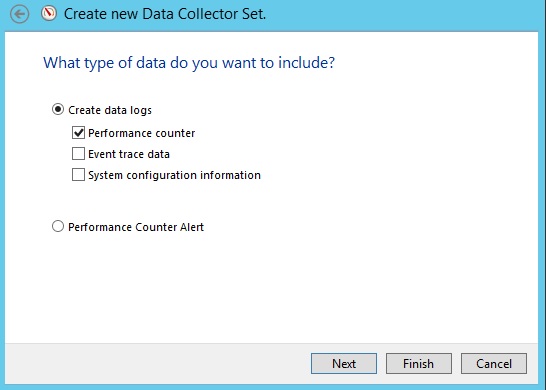
The collector set needs to be of type “Performance counter”:
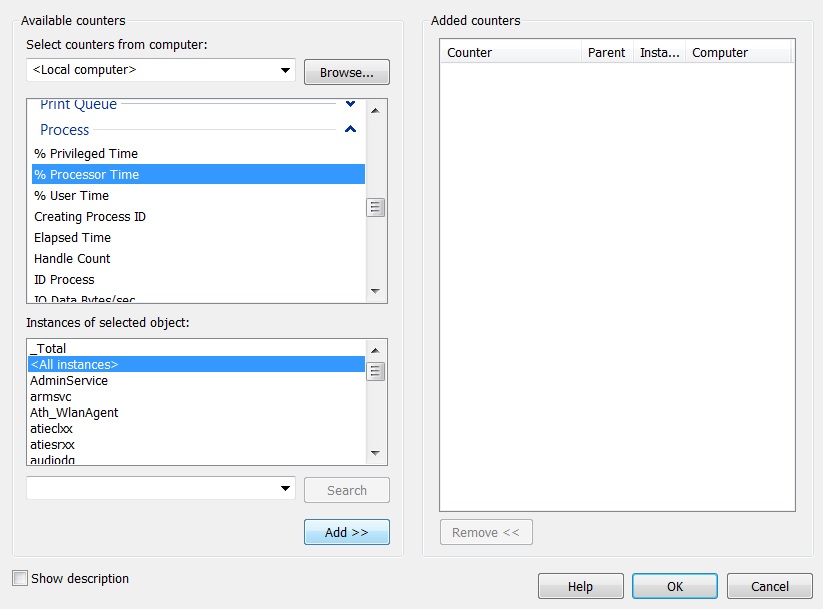
In order to collect individual CPU usage of the processes we need to select the “%Processor Time” counter’s all instances:
Now we have successfully set up the data collector and we can start collecting the CPU performance data. A great advantage of choosing “All instances” is that even processes which will spawn later will be tracked this way.
When we are done collecting the data we can stop the collection and open the logfile in PerfMon and add the counters. Here we can choose “All Instances” or select only the processes we are interested in:
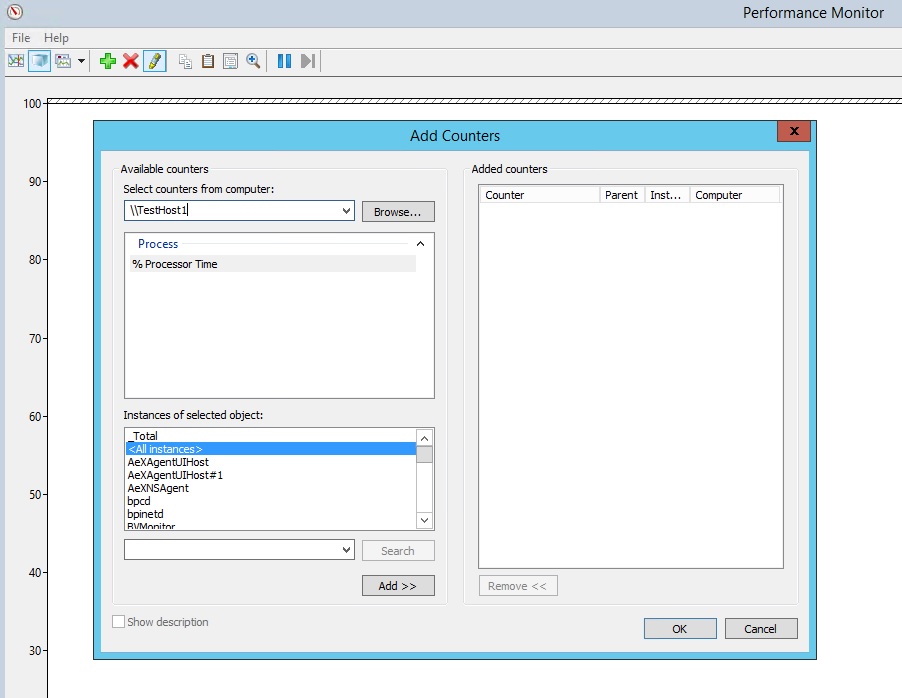
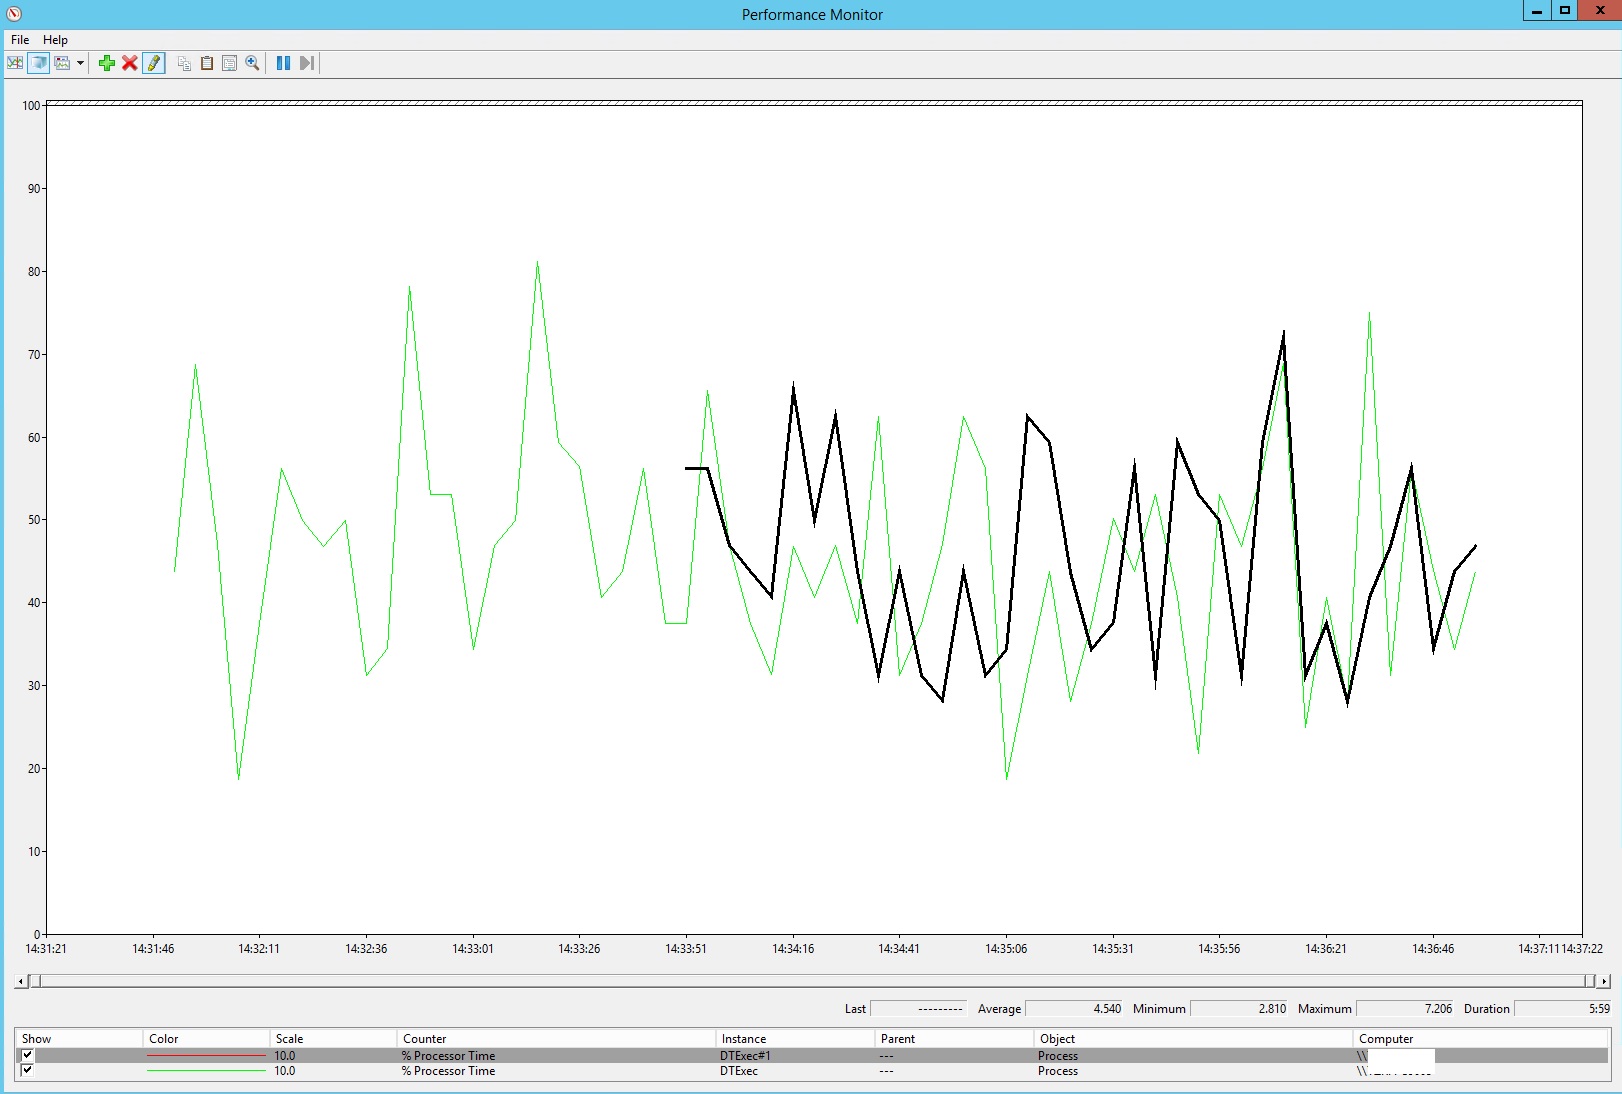
So now we can see the individual CPU usage of each process which was running while our Data collector was active:
If you would like to set up these counters on many hosts I recommend using logman for this. Logman is basically a windows built in command line tool to set up
performance counters with parameters. In my case I used it to set up the CPU monitoring for individual processes with an 5 sec sampling and a max size of 1024
MB:
logman create counter -s <HOSTNAME> -n "CPU All Processes" -si 5 -max 1024 -c "\Process(*)\% Processor Time" -o "C:PerfLogs\cpu_all_proc.blg"
To start collecting the data with our new data collector set we can use the following command:
logman start -s <HOSTNAME> -n "CPU All Processes"
You can find the logman documentation on the Microsoft Technet website:
